
Technology
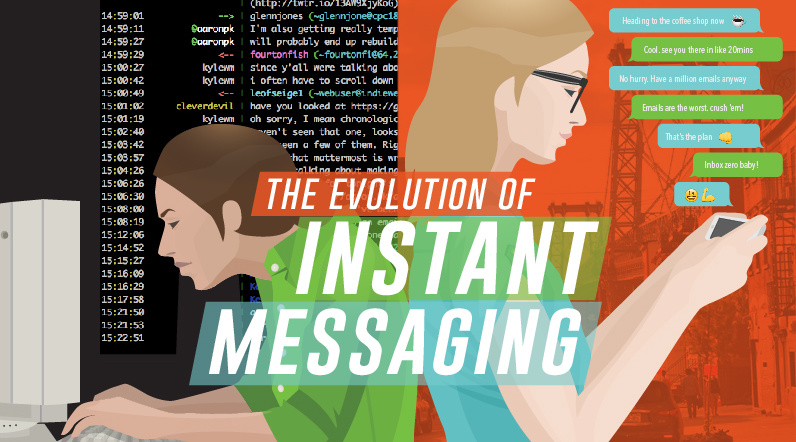
The Evolution of Instant Messaging

The concept of instant messaging crossed into the mainstream in the 1990s, allowing friends, acquaintances, colleagues, and like-minded thinkers from all over the world to connect in real-time.
Since then, instant messaging has revolutionized how we communicate, and today over 2.5 billion people are signed up for at least one messaging app. The present IM experience is seamless, and it intuitively integrates features like video, photos, voice, e-commerce, and gaming with plain-old messaging.
However, despite the impressive features of dominant apps like Snapchat, Facebook Messenger, and Whatsapp, today’s technology would simply not be possible without the earlier breakthroughs of their more rudimentary predecessors.
Instant Messaging: Past, Present, and Future
The following infographic from Hello Pal, a messaging app allowing for instant translation, shows the evolution of instant messaging. It pays homage to the advancements made in the early days by apps such as ICQ or AIM, while also looking at the trends in IM that will surface in the coming years.

While messaging is commonplace today, it was only two decades ago that chatting with friends and strangers online was a revolutionary concept.
The History of Instant Messaging
1961 – MIT’s Compatible Time-Sharing System (CTSS), along with other multi-user operating systems, helps to pioneer instant messaging by allowing up to 30 users to chat in real-time.
1988 – Internet Relay Chat (IRC) allows users to connect to networks with client software to chat with groups in real-time. IRC peaked in popularity in the 1990s, but still has hundreds of thousands of users today.
The late 1990s sees the first major competing IM platforms arrive: ICQ, AIM, MSN, and Yahoo all fight for market share in the new instant messaging market.
1992 – The first SMS message, “Merry Christmas”, is sent over the Vodafone GSM network in the U.K. in December.
1996 – Israeli company Mirabilis launches ICQ, which allowed users to chat one-on-one or in groups, exchange files, and search for other users. At its peak in 2001, ICQ had over 100 million accounts registered.
1997 – AOL launches AOL Instant Messenger (AIM), which pioneers the “Buddy List” concept. By the mid-2000s, AIM has the largest share of the instant messaging market in North America with 52%.
1998 – Yahoo! Messenger launches, allowing users with a Yahoo! ID to connect.
1999 – Microsoft releases MSN Messenger, a competitor to AIM and Yahoo. By 2005, roughly 2.5 billion messages are sent each day on the platform.
1999 – Across the Pacific Ocean, Tencent Holdings launches its first successful app. It’s called QQ, and it is initially a near-exact clone of ICQ.
To many, the 2000s is a Golden Age for instant messaging. Sharing photos, making video calls, and playing games are now common platform features
2001: By this time, only 30 million SMS text messages are sent per month in the United States.
2002: Apple launches iChat for its Mac OS X operating system, which is compatible with AIM.
2003: Skype allows Internet users to communicate with others through video, voice and instant messaging.
2005: Google Talk, available in a Gmail user’s window, is launched to allow easy communication between email contacts.
2006: MySpace launches the first instant messaging platform built within a social network: MySpaceIM.
2006: Market Snapshot (US Market)
- AIM: 53 million
- MSN: 27 million
- Yahoo: 22 million
- Google: 866,000
2006: By this time, 12.5 billion SMS text messages were sent each month in the United States
2008: Facebook Chat is released, allowing Facebook users to message friends or groups of friends on the social network. (Later on, Facebook would release a standalone mobile app version called Facebook Messenger in 2011.)
2009: An upstart WhatsApp allows users to text, send video, and audio for free.
Instant messaging undergoes a renaissance in the 2010s, as new apps like Snapchat, WhatsApp, and WeChat change how the game is played.
The popularity of new platforms change the concept of messaging entirely:
WeChat (2011)
Initially started by Tencent as a clone of WhatsApp, WeChat is now much more than a chat app. It’s a fully integrated mobile platform with shopping, payments, games, and much more.
WeChat processed $46 billion in payments in January 2016 – that’s about as twice as much as Paypal.
Snapchat (2011)
Snapchat, which is popular with millennials, allows users to send “snaps” which disappear after an allotted amount of time.
The app has evolved into a mix of private and public content, including brand networks and coverage of live events.
Slack (2013)
Slack’s workplace collaboration software allows teams to communicate easily and efficiently.
Slack was the fastest company to hit “unicorn” status ever, taking just 1.25 years to be worth over $1 billion.






Innovation
Mapped: The World’s Top Innovation Clusters
Discover the world’s top innovation clusters in 2025, from Silicon Valley to Shenzhen, and see where global breakthroughs are happening.


Mapped: The World’s Top Innovation Clusters
See visuals like this from many other data creators on our Voronoi app. Download the app for free on iOS or Android and discover data-driven charts from a variety of trusted sources.
Key Takeaways:
- China hosts 24 of the world’s top 100 innovation clusters, surpassing the U.S. (22) for the largest number of leading hubs.
- The world’s top 10 innovation clusters generate nearly 40% of global patent filings, showing how concentrated global innovation has become.
- Just 33 economies account for all 100 leading clusters, which together represent roughly 70% of global patent applications and venture capital activity.
Innovation is often discussed at the national level, but breakthrough technologies tend to emerge from smaller geographic hubs where researchers, startups, investors, and established companies interact closely.
Using data from the World Intellectual Property Organization’s (WIPO) Global Innovation Index 2025, this graphic ranks the world’s top innovation clusters based on scientific publications, international patent filings, and venture capital activity.
The rankings highlight where research, capital, and entrepreneurship are combining to create the world’s most influential innovation ecosystems.
Where Are the World’s Top Innovation Clusters?
The table below shows the world’s leading innovation clusters according to WIPO’s 2025 rankings.
| Rank | Innovation Cluster | Country |
|---|---|---|
| 1 | Shenzhen–Hong Kong–Guangzhou | 🇨🇳 🇭🇰 China / Hong Kong |
| 2 | Tokyo–Yokohama | 🇯🇵 Japan |
| 3 | San Jose–San Francisco | 🇺🇸 United States |
| 4 | Beijing | 🇨🇳 China |
| 5 | Seoul | 🇰🇷 South Korea |
| 6 | Shanghai–Suzhou | 🇨🇳 China |
| 7 | New York City | 🇺🇸 United States |
| 8 | London | 🇬🇧 United Kingdom |
| 9 | Boston–Cambridge | 🇺🇸 United States |
| 10 | Los Angeles | 🇺🇸 United States |
| 11 | Osaka–Kobe–Kyoto | 🇯🇵 Japan |
| 12 | Paris | 🇫🇷 France |
| 13 | Hangzhou | 🇨🇳 China |
| 14 | San Diego | 🇺🇸 United States |
| 15 | Nanjing | 🇨🇳 China |
| 16 | Singapore | 🇸🇬 🇲🇾 Singapore / Malaysia |
| 17 | Washington–Baltimore | 🇺🇸 United States |
| 18 | Wuhan | 🇨🇳 China |
| 19 | Tel Aviv–Jerusalem | 🇮🇱 Israel |
| 20 | Seattle | 🇺🇸 United States |
| 21 | Bengaluru | 🇮🇳 India |
| 22 | Amsterdam–Rotterdam | 🇳🇱 Netherlands |
| 23 | Philadelphia | 🇺🇸 United States |
| 24 | Chengdu | 🇨🇳 China |
| 25 | Daejeon | 🇰🇷 South Korea |
| 26 | Delhi | 🇮🇳 India |
| 27 | Munich | 🇩🇪 Germany |
| 28 | Nagoya | 🇯🇵 Japan |
| 29 | Xi'an | 🇨🇳 China |
| 30 | Berlin | 🇩🇪 Germany |
| 31 | Chicago | 🇺🇸 United States |
| 32 | Stockholm | 🇸🇪 Sweden |
| 33 | Toronto | 🇨🇦 Canada |
| 34 | Qingdao | 🇨🇳 China |
| 35 | Denver | 🇺🇸 United States |
| 36 | Sydney | 🇦🇺 Australia |
| 37 | Austin | 🇺🇸 United States |
| 38 | Houston | 🇺🇸 United States |
| 39 | Hefei | 🇨🇳 China |
| 40 | Zürich | 🇨🇭 Switzerland |
| 41 | Taipei–Hsinchu | 🇹🇼 Taiwan* |
| 42 | Copenhagen | 🇩🇰 Denmark |
| 43 | Cologne | 🇩🇪 Germany |
| 44 | Changsha | 🇨🇳 China |
| 45 | Barcelona | 🇪🇸 Spain |
| 46 | Mumbai | 🇮🇳 India |
| 47 | Madrid | 🇪🇸 Spain |
| 48 | Moscow | 🇷🇺 Russia |
| 49 | São Paulo | 🇧🇷 Brazil |
| 50 | Tianjin | 🇨🇳 China |
| 51 | Minneapolis | 🇺🇸 United States |
| 52 | Melbourne | 🇦🇺 Australia |
| 53 | Raleigh | 🇺🇸 United States |
| 54 | Stuttgart | 🇩🇪 Germany |
| 55 | Brussels–Antwerp | 🇧🇪 Belgium |
| 56 | Milan | 🇮🇹 Italy |
| 57 | Chongqing | 🇨🇳 China |
| 58 | Istanbul | 🇹🇷 Turkey |
| 59 | Atlanta | 🇺🇸 United States |
| 60 | Helsinki | 🇫🇮 Finland |
| 61 | Dallas | 🇺🇸 United States |
| 62 | Montréal | 🇨🇦 Canada |
| 63 | Tehran | 🇮🇷 Iran |
| 64 | Frankfurt am Main | 🇩🇪 Germany |
| 65 | Eindhoven | 🇳🇱 Netherlands |
| 66 | Vancouver | 🇨🇦 Canada |
| 67 | Miami | 🇺🇸 United States |
| 68 | Jinan | 🇨🇳 China |
| 69 | Cambridge | 🇬🇧 United Kingdom |
| 70 | Harbin | 🇨🇳 China |
| 71 | Dublin | 🇮🇪 Ireland |
| 72 | Changchun | 🇨🇳 China |
| 73 | Portland | 🇺🇸 United States |
| 74 | Vienna | 🇦🇹 Austria |
| 75 | Shenyang | 🇨🇳 China |
| 76 | Pittsburgh | 🇺🇸 United States |
| 77 | Oxford | 🇬🇧 United Kingdom |
| 78 | Phoenix | 🇺🇸 United States |
| 79 | Mexico City | 🇲🇽 Mexico |
| 80 | Zhengzhou | 🇨🇳 China |
| 81 | Xiamen | 🇨🇳 China |
| 82 | Rome | 🇮🇹 Italy |
| 83 | Cairo | 🇪🇬 Egypt |
| 84 | Chennai | 🇮🇳 India |
| 85 | Oslo | 🇳🇴 Norway |
| 86 | Kuala Lumpur | 🇲🇾 Malaysia |
| 87 | Heidelberg–Mannheim | 🇩🇪 Germany |
| 88 | Dalian | 🇨🇳 China |
| 89 | Warsaw | 🇵🇱 Poland |
| 90 | Lyon | 🇫🇷 France |
| 91 | Hamburg | 🇩🇪 Germany |
| 92 | Salt Lake City | 🇺🇸 United States |
| 93 | Ningbo | 🇨🇳 China |
| 94 | Manchester | 🇬🇧 United Kingdom |
| 95 | Busan | 🇰🇷 South Korea |
| 96 | Ann Arbor | 🇺🇸 United States |
| 97 | Göteborg | 🇸🇪 Sweden |
| 98 | Macau–Zhuhai | 🇨🇳 China |
| 99 | Ningde | 🇨🇳 China |
| 100 | Zhenjiang | 🇨🇳 China |
China and the U.S. dominate the rankings, while innovation hotspots in Japan, South Korea, Europe, and India also feature prominently.
Shenzhen–Hong Kong–Guangzhou claims the top spot globally, followed by Tokyo–Yokohama and Silicon Valley’s San Jose–San Francisco corridor.
Unlike city rankings, WIPO’s clusters often span multiple metropolitan areas and even national borders. The organization uses a bottom-up methodology that identifies regions with dense concentrations of inventors and scientific authors, rather than relying on political boundaries. As a result, clusters often represent entire innovation ecosystems rather than individual cities.
The Concentration of Innovation
Innovation clusters emerge because talent, capital, and institutions tend to reinforce one another. Leading research universities attract scientists, successful startups attract investors, and large technology firms create opportunities for commercialization. Over time, these advantages compound.
This dynamic helps explain why a handful of regions consistently dominate global innovation. Silicon Valley benefits from world-class universities, deep venture capital markets, and a culture of entrepreneurship. Similarly, China’s leading clusters have been supported by sustained investment in research, advanced manufacturing, and technology commercialization.
The concentration of innovation has become an increasingly important factor in global economic competition. Recent analysis from Foreign Affairs argues that technological leadership is now a central pillar of geopolitical power, while research from CSIS highlights how government-supported R&D ecosystems can accelerate innovation capacity.
China’s Rise Reshapes the Innovation Map
One of the most notable trends in recent years has been the rapid rise of Chinese innovation clusters. Shenzhen–Hong Kong–Guangzhou now ranks as the world’s leading cluster, while Beijing and Shanghai–Suzhou also place among the global elite. China hosts more top-100 clusters than any other economy.
At the same time, the U.S. remains a dominant force in commercialization and venture capital. New York, Los Angeles, Boston, Seattle, and Silicon Valley continue to rank among the world’s most influential innovation ecosystems. In areas such as artificial intelligence innovation, American clusters continue to attract a disproportionate share of global investment and entrepreneurial activity.
Learn More on the Voronoi App 
To see how innovation leadership has evolved over centuries, and what today’s leading clusters might signal about the future, check out Long Waves: The History of Innovation Cycles on the Voronoi app.
Technology
Ranked: The World’s Most Valuable Unicorns in 2026
See the world’s highest-valued private startups in 2026, led by AI giants Anthropic and OpenAI.


Ranked: The World’s Most Valuable Unicorns in 2026
See visuals like this from many other data creators on our Voronoi app. Download it for free on iOS or Android and discover incredible data-driven charts from a variety of trusted sources.
Key Takeaways
- The world’s 30 most valuable unicorns are worth a combined $3.9 trillion.
- AI companies account for roughly 60% of that combined valuation.
- Just two companies, Anthropic and OpenAI, make up nearly half of the total value shown in this ranking.
The world’s most valuable unicorns are no longer led by fintech, e-commerce, or social media platforms. In 2026, artificial intelligence companies dominate the top of the private-market rankings.
This graphic ranks the world’s most valuable unicorn companies, defined as private firms valued at $1 billion or more.
The data comes from Crunchbase, based on each firm’s latest reported private-market valuation.
AI Dominates the Unicorn Landscape
Anthropic tops the ranking with a valuation of $965 billion, followed closely by OpenAI at $852 billion. Together, these two AI leaders are worth a combined $1.8 trillion.
| Rank | Company | Valuation |
|---|---|---|
| 1 | 🇺🇸 Anthropic | $965B |
| 2 | 🇺🇸 OpenAI | $852B |
| 3 | 🇨🇳 ByteDance | $480B |
| 4 | 🇺🇸 Stripe | $159B |
| 5 | 🇨🇳 Ant Group | $150B |
| 6 | 🇺🇸 Databricks | $134B |
| 7 | 🇺🇸 Waymo | $126B |
| 8 | 🇮🇳 Reliance Retail | $101B |
| 9 | 🇬🇧 Revolut | $75B |
| 10 | 🇨🇳 Shein | $66B |
| 11 | 🇺🇸 Anduril Industries | $61B |
| 12 | 🇮🇳 Reliance Jio | $58B |
| 13 | 🇺🇸 Ramp | $44B |
| 14 | 🇦🇺 Canva | $42B |
| 15 | 🇬🇧 Checkout.com | $40B |
| 16 | 🇺🇸 Ripple | $40B |
| 17 | 🇺🇸 Figure | $39B |
| 18 | 🇺🇸 Project Prometheus | $38B |
| 19 | 🇺🇸 Safe Superintelligence | $32B |
| 20 | 🇺🇸 Fanatics | $31B |
| 21 | 🇨🇳 Alibaba Bendi Shenghuo Fuwu Gongsi | $30B |
| 22 | 🇺🇸 VAST Data | $30B |
| 23 | 🇺🇸 Anysphere | $29B |
| 24 | 🇺🇸 Scale | $29B |
| 25 | 🇺🇸 Cognition | $26B |
| 26 | 🇸🇨 OKX | $25B |
| 27 | 🇬🇧 FNZ | $24B |
| 28 | 🇺🇸 JUUL | $23B |
| 29 | 🇺🇸 Epic Games | $23B |
| 30 | 🇨🇳 Yangtze Memory Technologies | $23B |
Beyond the top two, several other AI-focused companies appear in the rankings, including Databricks, Figure, Safe Superintelligence, Anysphere, Scale AI, and Cognition.
The United States Leads Global Unicorn Creation
American companies dominate the list, accounting for a substantial majority of the top-ranked unicorns.
This leadership reflects the depth of U.S. venture capital markets, access to technical talent, and a mature startup ecosystem capable of scaling companies to enormous valuations.
At the same time, the list highlights how innovation remains geographically diverse. China, India, the United Kingdom, Australia, and Seychelles are all represented among the world’s most valuable private companies.
Fintech, Commerce, and Mobility Remain Major Themes
While AI captures much of the spotlight, several of the world’s largest unicorns operate in other industries.
Stripe, Revolut, Checkout.com, and Ramp are among the highest-valued fintech companies, reflecting ongoing demand for digital financial services.
China’s ByteDance remains one of the largest private companies globally, while Shein continues to demonstrate the scale that online retail platforms can achieve.
In mobility and transportation, Waymo’s valuation highlights investor optimism surrounding autonomous driving technologies.
The list also includes Alibaba Bendi Shenghuo Fuwu Gongsi, Alibaba Group’s local services division, which includes food delivery and on-demand commerce platforms.
Learn More on the Voronoi App
If you enjoyed today’s post, check out Ranked: The Biggest U.S. Companies by Revenue (2024–2026) on Voronoi.
-
 Agriculture2 weeks ago
Which States Produce the Most Food in America?
-
Media2 weeks ago
Ranked: America’s Best-Selling Albums Ever
-
Cost of Living3 weeks ago
Ranked: U.S. Cities by Family Income Needed to Live Comfortably
-
Currency3 weeks ago
Ranked: Countries with the Largest Currency Reserves
-
Public Opinion4 weeks ago
Ranked: How 45 Countries View America
-
Money4 weeks ago
Ranked: The World’s Top Billionaire Cities in 2026
-
Misc3 weeks ago
Ranked: The Countries That Brew the Most Beer
-
Media1 week ago
Ranked: The 50 Highest-Paid Creators in 2026


